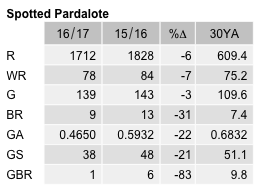
Spotted Pardalote
Pardalotus punctatus
ABR description
The following is extracted from the Annual Bird Report for the twelve months to June 2017.
Very common, breeding resident/migrant
Easily recognised from its call, foraging in larger eucalypts.
General: Reporting rate 12.3% is down around 22% on last year as well as down on the 10 and 30YAs. It is the lowest it has been since 1995. Abundance (0.36) is also low, approaching the record lows of 1995 and 1996. Mean 3.0 median 2, max 165/9 Apr Bredbo GrL28 (TaN1) is above the 30YA (130). Seasonal distribution follows the long-term pattern of a low (16%) in summer. 10 breeding records from 7 grid cells: first ih/7 Aug Percival Hill NR (HaJ7) and last dy/27 Nov Callum Brae NR (SmA1).
GBS: Another decrease from the previous year, with 626 records from 38 sites (64%), from all weeks. Abundance (32%) is under the 30YA. Mean 2 with max 15/2wk Apr Ainslie (HoS1). Only 1 breeding record this year: dy/2wk Jan Page (AlB1), cf 6 last year and 30 3 years ago.
Abundance
Abundance is the average number of birds of that species per survey. Where the species was observed (presence recorded) but the number of birds seen was not recorded, this is treated as a count of zero.
Abundance by year
This chart shows the abundance of Spotted Pardalote between 1982 and 2017. 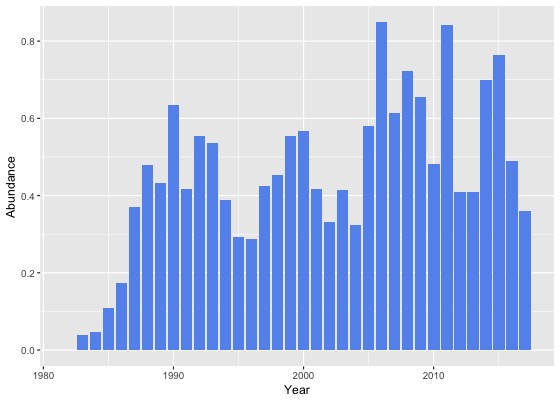
Abundance by month
This chart shows the monthly abundance of Spotted Pardalote. The blue lines show the abundance for the twelve months to June 2017 and the bars show the average abundance for the period 1982 to 2017. 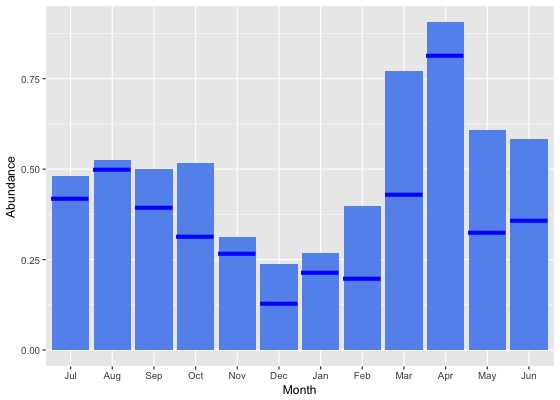
Abundance by season
This chart shows the seasonal abundance of Spotted Pardalote. The blue lines show the seasonal abundance for the twelve months to June 2017 and the bars show the average seasonal abundance for the period 1982 to 2017. 
Abundance data
| Month | Season | ||||||||||||||||||
|---|---|---|---|---|---|---|---|---|---|---|---|---|---|---|---|---|---|---|---|
| Period | Jul | Aug | Sep | Oct | Nov | Dec | Jan | Feb | Mar | Apr | May | Jun | Winter | Spring | Summer | Autumn | All | ||
| All years | |||||||||||||||||||
| All | 0.5 | 0.5 | 0.5 | 0.5 | 0.3 | 0.2 | 0.3 | 0.4 | 0.8 | 0.9 | 0.6 | 0.6 | 0.5 | 0.5 | 0.3 | 0.8 | 0.5 | ||
| Previous years | |||||||||||||||||||
| All previous years | 0.5 | 0.5 | 0.5 | 0.5 | 0.3 | 0.3 | 0.3 | 0.4 | 0.8 | 0.9 | 0.7 | 0.6 | 0.6 | 0.5 | 0.3 | 0.8 | 0.5 | ||
| Previous 30 years | 0.5 | 0.5 | 0.5 | 0.5 | 0.3 | 0.3 | 0.3 | 0.4 | 0.8 | 0.9 | 0.7 | 0.6 | 0.6 | 0.5 | 0.3 | 0.8 | 0.5 | ||
| Previous 20 years | 0.5 | 0.6 | 0.5 | 0.6 | 0.3 | 0.2 | 0.3 | 0.5 | 0.9 | 1.0 | 0.7 | 0.7 | 0.6 | 0.5 | 0.3 | 0.9 | 0.6 | ||
| 10 year groups | |||||||||||||||||||
| [2007,2017) | 0.6 | 0.7 | 0.6 | 0.6 | 0.3 | 0.3 | 0.3 | 0.5 | 0.9 | 1.0 | 0.7 | 0.7 | 0.6 | 0.5 | 0.3 | 0.9 | 0.6 | ||
| [1997,2007) | 0.4 | 0.4 | 0.5 | 0.4 | 0.3 | 0.2 | 0.2 | 0.5 | 0.7 | 1.0 | 0.7 | 0.7 | 0.5 | 0.4 | 0.3 | 0.8 | 0.5 | ||
| [1987,1997) | 0.3 | 0.4 | 0.5 | 0.4 | 0.3 | 0.3 | 0.3 | 0.3 | 0.7 | 0.7 | 0.6 | 0.4 | 0.4 | 0.4 | 0.3 | 0.6 | 0.4 | ||
| 5 year groups | |||||||||||||||||||
| [2012,2017) | 0.6 | 0.7 | 0.6 | 0.5 | 0.3 | 0.3 | 0.2 | 0.4 | 0.8 | 0.9 | 0.8 | 0.7 | 0.7 | 0.5 | 0.3 | 0.8 | 0.6 | ||
| [2007,2012) | 0.5 | 0.4 | 0.5 | 0.8 | 0.4 | 0.3 | 0.4 | 0.6 | 1.3 | 1.2 | 0.6 | 0.6 | 0.6 | 0.6 | 0.4 | 1.1 | 0.7 | ||
| [2002,2007) | 0.4 | 0.4 | 0.4 | 0.4 | 0.3 | 0.2 | 0.2 | 0.5 | 0.8 | 0.9 | 0.6 | 0.8 | 0.6 | 0.4 | 0.3 | 0.8 | 0.5 | ||
| [1997,2002) | 0.5 | 0.4 | 0.5 | 0.4 | 0.2 | 0.2 | 0.2 | 0.5 | 0.6 | 1.0 | 0.7 | 0.6 | 0.5 | 0.4 | 0.3 | 0.8 | 0.5 | ||
| [1992,1997) | 0.2 | 0.4 | 0.4 | 0.3 | 0.3 | 0.2 | 0.2 | 0.2 | 0.8 | 0.6 | 0.7 | 0.3 | 0.3 | 0.3 | 0.2 | 0.7 | 0.4 | ||
| [1987,1992) | 0.4 | 0.4 | 0.5 | 0.4 | 0.4 | 0.4 | 0.4 | 0.3 | 0.6 | 0.7 | 0.5 | 0.4 | 0.4 | 0.4 | 0.4 | 0.6 | 0.5 | ||
| Year | |||||||||||||||||||
| 2017 | 0.4 | 0.5 | 0.4 | 0.3 | 0.3 | 0.1 | 0.2 | 0.2 | 0.4 | 0.8 | 0.3 | 0.4 | 0.4 | 0.3 | 0.2 | 0.5 | 0.4 | ||
| 2016 | 0.6 | 0.5 | 0.5 | 0.4 | 0.4 | 0.3 | 0.2 | 0.3 | 0.7 | 0.8 | 0.5 | 0.5 | 0.6 | 0.5 | 0.3 | 0.7 | 0.5 | ||
| 2015 | 0.9 | 1.5 | 1.0 | 0.7 | 0.4 | 0.3 | 0.3 | 0.7 | 0.6 | 1.4 | 0.9 | 0.8 | 1.0 | 0.7 | 0.4 | 1.0 | 0.8 | ||
| 2014 | 0.5 | 0.6 | 0.3 | 0.6 | 0.3 | 0.3 | 0.3 | 0.7 | 1.5 | 0.9 | 1.4 | 1.0 | 0.8 | 0.4 | 0.4 | 1.3 | 0.7 | ||
| 2013 | 0.5 | 0.4 | 0.4 | 0.6 | 0.3 | 0.2 | 0.2 | 0.2 | 0.7 | 0.5 | 0.7 | 0.4 | 0.4 | 0.4 | 0.2 | 0.6 | 0.4 | ||
| 2012 | 0.3 | 0.4 | 0.4 | 0.5 | 0.2 | 0.2 | 0.1 | 0.3 | 0.7 | 0.7 | 0.3 | 0.6 | 0.5 | 0.4 | 0.2 | 0.7 | 0.4 | ||
| 2011 | 0.6 | 0.4 | 0.4 | 0.6 | 0.4 | 0.2 | 0.7 | 0.6 | 2.6 | 1.6 | 0.5 | 0.9 | 0.7 | 0.5 | 0.5 | 1.6 | 0.8 | ||
| 2010 | 0.2 | 0.3 | 0.4 | 0.7 | 0.2 | 0.1 | 0.1 | 0.3 | 0.5 | 1.0 | 0.9 | 0.7 | 0.5 | 0.5 | 0.1 | 0.8 | 0.5 | ||
| 2009 | 0.6 | 0.7 | 0.5 | 1.0 | 0.5 | 0.3 | 0.4 | 0.8 | 1.1 | 1.0 | 0.2 | 0.2 | 0.4 | 0.7 | 0.5 | 0.8 | 0.7 | ||
| 2008 | 0.4 | 0.2 | 0.5 | 0.8 | 0.5 | 0.3 | 0.5 | 0.7 | 0.6 | 1.3 | 1.2 | 1.1 | 0.6 | 0.7 | 0.4 | 1.1 | 0.7 | ||
| 2007 | 0.9 | 0.5 | 0.6 | 0.8 | 0.3 | 0.5 | 0.4 | 0.6 | 1.2 | 0.6 | 0.7 | 0.3 | 0.4 | 0.7 | 0.5 | 0.9 | 0.6 | ||
| 2006 | 0.7 | 0.6 | 0.5 | 1.0 | 0.4 | 0.4 | 0.3 | 0.3 | 1.6 | 1.4 | 0.5 | 1.3 | 1.0 | 0.7 | 0.3 | 1.3 | 0.8 | ||
| 2005 | 0.5 | 0.4 | 0.4 | 0.1 | 0.2 | 0.3 | 0.5 | 0.9 | 0.6 | 0.8 | 1.0 | 1.0 | 0.8 | 0.3 | 0.5 | 0.8 | 0.6 | ||
| 2004 | 0.2 | 0.1 | 0.4 | 0.1 | 0.3 | 0.1 | 0.1 | 0.2 | 0.5 | 0.6 | 0.5 | 0.9 | 0.3 | 0.3 | 0.1 | 0.6 | 0.3 | ||
| 2003 | 0.4 | 0.6 | 0.5 | 0.3 | 0.3 | 0.1 | 0.1 | 0.7 | 0.5 | 0.8 | 0.4 | 0.2 | 0.4 | 0.4 | 0.3 | 0.6 | 0.4 | ||
| 2002 | 0.3 | 0.5 | 0.4 | 0.1 | 0.3 | 0.2 | 0.1 | 0.3 | 0.3 | 0.9 | 0.4 | 0.4 | 0.4 | 0.3 | 0.2 | 0.5 | 0.3 | ||
| 2001 | 0.5 | 0.3 | 0.6 | 0.4 | 0.2 | 0.2 | 0.1 | 0.3 | 0.5 | 0.7 | 0.6 | 0.5 | 0.4 | 0.4 | 0.2 | 0.6 | 0.4 | ||
| 2000 | 0.8 | 0.7 | 0.4 | 0.3 | 0.3 | 0.2 | 0.3 | 0.7 | 0.8 | 1.4 | 0.5 | 0.4 | 0.6 | 0.4 | 0.4 | 1.0 | 0.6 | ||
| 1999 | 0.3 | 0.2 | 0.4 | 0.3 | 0.2 | 0.1 | 0.3 | 0.5 | 0.8 | 0.8 | 1.1 | 0.9 | 0.7 | 0.3 | 0.3 | 0.9 | 0.6 | ||
| 1998 | 0.1 | 0.4 | 0.9 | 0.9 | 0.2 | 0.7 | 0.4 | 0.3 | 0.2 | 0.3 | 0.6 | 0.1 | 0.2 | 0.6 | 0.5 | 0.3 | 0.5 | ||
| 1997 | 0.1 | 0.2 | 0.2 | 0.4 | 0.1 | 0.1 | 0.2 | 0.1 | 1.4 | 1.5 | 0.5 | 0.6 | 0.3 | 0.2 | 0.1 | 1.3 | 0.4 | ||
| 1996 | 0.3 | 0.3 | 0.7 | 0.2 | 0.2 | 0.2 | 0.1 | 0.2 | 0.3 | 0.2 | 0.8 | 0.2 | 0.3 | 0.3 | 0.2 | 0.4 | 0.3 | ||
| 1995 | 0.2 | 0.2 | 0.1 | 0.4 | 0.4 | 0.1 | 0.1 | 0.1 | 0.6 | 0.5 | 0.3 | 0.4 | 0.3 | 0.3 | 0.1 | 0.5 | 0.3 | ||
| 1994 | 0.2 | 0.7 | 0.4 | 0.4 | 0.1 | 0.2 | 0.2 | 0.2 | 1.2 | 0.2 | 0.1 | 0.6 | 0.5 | 0.3 | 0.2 | 0.5 | 0.4 | ||
| 1993 | 0.5 | 0.7 | 0.3 | 0.3 | 0.3 | 0.6 | 0.4 | 0.1 | 1.0 | 1.2 | 0.5 | 0.2 | 0.5 | 0.3 | 0.4 | 0.9 | 0.5 | ||
| 1992 | 0.1 | 0.0 | 0.5 | 0.3 | 0.3 | 0.1 | 0.1 | 0.7 | 1.0 | 1.5 | 1.7 | 0.1 | 0.1 | 0.4 | 0.3 | 1.4 | 0.6 | ||
| 1991 | 0.5 | 0.4 | 0.9 | 0.2 | 0.2 | 0.2 | 0.3 | 0.3 | 0.7 | 0.9 | 0.1 | 0.4 | 0.4 | 0.4 | 0.3 | 0.6 | 0.4 | ||
| 1990 | 0.3 | 0.3 | 0.4 | 0.2 | 0.2 | 0.4 | 0.6 | 0.3 | 1.4 | 2.4 | 1.2 | 0.9 | 0.4 | 0.3 | 0.4 | 1.7 | 0.6 | ||
| 1989 | 0.4 | 0.4 | 0.6 | 0.5 | 0.4 | 0.5 | 0.4 | 0.4 | 0.4 | 0.4 | 0.4 | 0.3 | 0.4 | 0.5 | 0.4 | 0.4 | 0.4 | ||
| 1988 | 0.4 | 0.5 | 0.5 | 0.5 | 0.4 | 0.4 | 0.4 | 0.5 | 0.6 | 0.6 | 0.5 | 0.4 | 0.5 | 0.4 | 0.4 | 0.6 | 0.5 | ||
| 1987 | 0.1 | 0.1 | 0.4 | 0.3 | 0.4 | 0.3 | 0.3 | 0.2 | 0.4 | 0.4 | 0.4 | 0.4 | 0.4 | 0.4 | 0.3 | 0.4 | 0.4 | ||
| 1986 | 0.3 | 0.2 | 0.1 | 0.3 | 0.2 | 0.1 | 0.1 | 0.1 | 0.3 | 0.2 | 0.2 | 0.1 | 0.2 | 0.2 | 0.1 | 0.2 | 0.2 | ||
| 1985 | 0.3 | 0.1 | 0.1 | 0.0 | 0.1 | 0.1 | 0.1 | 0.1 | 0.1 | 0.1 | 0.1 | 0.1 | 0.2 | 0.1 | 0.1 | 0.1 | 0.1 | ||
| 1984 | 0.0 | 0.0 | 0.0 | 0.0 | 0.0 | 0.0 | 0.0 | 0.0 | 0.1 | 0.0 | 0.2 | 0.0 | 0.0 | 0.0 | 0.0 | 0.1 | 0.0 | ||
| 1983 | 0.0 | 0.0 | 0.0 | 0.1 | 0.2 | 0.0 | 0.0 | 0.1 | 0.0 | - | 0.0 | 0.0 | 0.0 | 0.1 | 0.0 | 0.0 | 0.0 | ||
| 1982 | - | 0.0 | - | 0.0 | 0.0 | 0.0 | - | 0.0 | - | 0.0 | - | 0.0 | 0.0 | 0.0 | 0.0 | 0.0 | 0.0 | ||
Reporting rates
Reporting rate is the proportion of all surveys in which the species was present.
Reporting rate by year
This chart shows the reporting rate of Spotted Pardalote each year between 1982 and 2017. 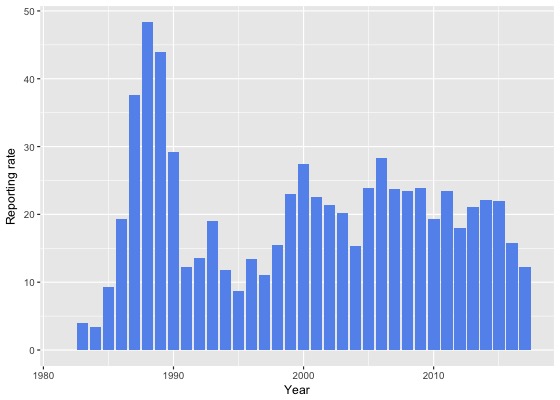
Reporting rate by month
This chart shows the reporting rate by month of Spotted Pardalote. The blue lines show the reporting rate for the twelve months to June 2017 and the bars show the average reporting rate for the period 1982 to 2017. 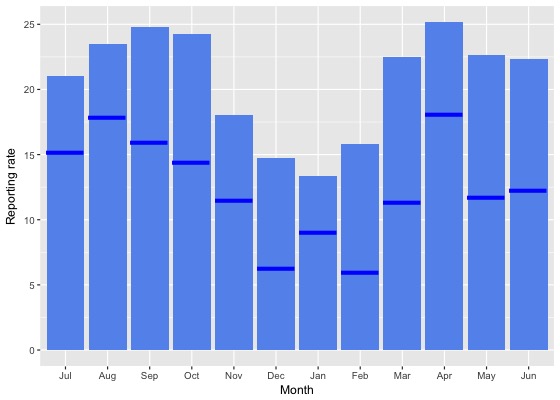
Reporting rate by season
This chart shows the seasonal reporting rate of Spotted Pardalote. The blue lines show the seasonal reporting rate for the twelve months to June 2017 and the bars show the average seasonal reporting rate for the period 1982 to 2017. 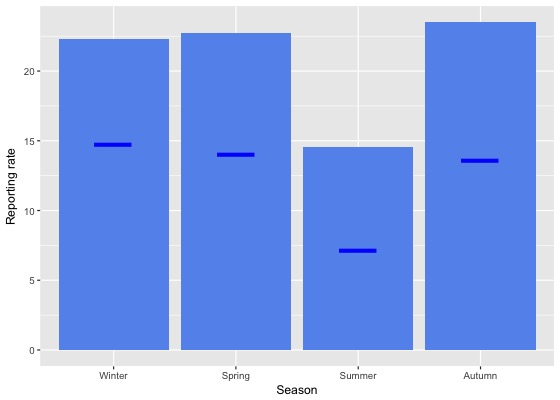
Reporting rate data
| Month | Season | ||||||||||||||||||
|---|---|---|---|---|---|---|---|---|---|---|---|---|---|---|---|---|---|---|---|
| Period | Jul | Aug | Sep | Oct | Nov | Dec | Jan | Feb | Mar | Apr | May | Jun | Winter | Spring | Summer | Autumn | All | ||
| All years | |||||||||||||||||||
| All | 21.0 | 23.5 | 24.8 | 24.3 | 18.0 | 14.8 | 13.4 | 15.8 | 22.5 | 25.1 | 22.6 | 22.4 | 22.3 | 22.7 | 14.6 | 23.5 | 20.8 | ||
| Previous years | |||||||||||||||||||
| All previous years | 21.9 | 24.5 | 26.0 | 25.6 | 19.0 | 16.0 | 14.2 | 17.9 | 24.5 | 26.3 | 25.2 | 24.3 | 23.7 | 24.0 | 15.9 | 25.3 | 22.2 | ||
| Previous 30 years | 22.1 | 24.9 | 26.2 | 25.9 | 19.1 | 16.2 | 14.3 | 18.1 | 24.5 | 26.5 | 25.3 | 24.6 | 24.0 | 24.2 | 16.0 | 25.4 | 22.4 | ||
| Previous 20 years | 20.6 | 22.8 | 24.8 | 25.4 | 16.1 | 13.6 | 12.3 | 16.4 | 23.4 | 25.1 | 23.2 | 23.9 | 22.7 | 22.9 | 13.9 | 24.0 | 20.8 | ||
| 10 year groups | |||||||||||||||||||
| [2007,2017) | 19.1 | 22.6 | 24.0 | 26.7 | 15.4 | 14.0 | 11.8 | 15.4 | 23.4 | 23.8 | 20.9 | 21.2 | 21.1 | 23.3 | 13.5 | 22.9 | 20.2 | ||
| [1997,2007) | 23.2 | 23.4 | 26.4 | 20.7 | 17.3 | 12.8 | 14.1 | 19.0 | 23.4 | 28.3 | 28.9 | 29.5 | 25.9 | 21.8 | 14.8 | 26.4 | 22.1 | ||
| [1987,1997) | 27.2 | 31.1 | 33.4 | 28.7 | 29.3 | 30.6 | 25.6 | 26.3 | 31.0 | 33.8 | 33.1 | 28.3 | 28.9 | 30.3 | 27.6 | 32.6 | 29.9 | ||
| 5 year groups | |||||||||||||||||||
| [2012,2017) | 18.6 | 23.9 | 24.7 | 24.8 | 14.8 | 14.2 | 10.9 | 14.7 | 22.0 | 21.4 | 20.6 | 19.8 | 20.8 | 22.2 | 13.0 | 21.4 | 19.2 | ||
| [2007,2012) | 20.7 | 17.7 | 22.5 | 29.9 | 17.1 | 13.7 | 15.1 | 18.2 | 27.2 | 29.5 | 21.6 | 23.9 | 21.8 | 25.4 | 15.2 | 26.9 | 22.8 | ||
| [2002,2007) | 22.1 | 23.6 | 25.4 | 22.4 | 17.9 | 13.2 | 13.9 | 18.9 | 23.6 | 29.3 | 25.0 | 29.3 | 25.5 | 22.2 | 14.8 | 25.8 | 22.1 | ||
| [1997,2002) | 25.0 | 23.1 | 27.6 | 18.2 | 16.6 | 12.3 | 14.3 | 19.1 | 23.1 | 27.2 | 33.7 | 29.7 | 26.4 | 21.3 | 14.8 | 27.1 | 22.1 | ||
| [1992,1997) | 10.2 | 14.1 | 12.7 | 11.3 | 12.8 | 12.0 | 7.4 | 11.1 | 15.5 | 15.3 | 17.4 | 12.5 | 12.5 | 12.2 | 10.0 | 16.0 | 12.8 | ||
| [1987,1992) | 34.8 | 40.3 | 43.2 | 38.2 | 37.2 | 38.7 | 35.6 | 32.1 | 40.2 | 44.4 | 41.2 | 37.2 | 37.5 | 39.3 | 35.6 | 42.0 | 38.6 | ||
| Year | |||||||||||||||||||
| 2017 | 15.1 | 17.8 | 16.0 | 14.4 | 11.5 | 6.2 | 9.0 | 5.9 | 11.4 | 18.1 | 11.8 | 12.2 | 14.8 | 14.0 | 7.2 | 13.6 | 12.3 | ||
| 2016 | 18.3 | 19.9 | 20.9 | 18.7 | 12.8 | 10.7 | 8.7 | 10.6 | 17.3 | 18.5 | 16.3 | 16.9 | 18.4 | 17.9 | 9.9 | 17.5 | 15.7 | ||
| 2015 | 21.9 | 36.9 | 32.7 | 27.0 | 17.9 | 13.6 | 12.0 | 18.9 | 24.4 | 21.4 | 22.9 | 19.5 | 25.0 | 26.2 | 14.6 | 22.9 | 21.9 | ||
| 2014 | 17.6 | 20.6 | 19.7 | 31.2 | 15.9 | 18.0 | 11.3 | 15.7 | 28.1 | 28.9 | 29.8 | 25.8 | 22.5 | 24.6 | 14.0 | 28.8 | 22.1 | ||
| 2013 | 15.5 | 19.9 | 26.4 | 27.9 | 15.6 | 16.5 | 15.0 | 19.1 | 25.0 | 24.9 | 25.9 | 18.1 | 17.8 | 24.2 | 16.6 | 25.1 | 21.1 | ||
| 2012 | 17.0 | 20.9 | 22.5 | 24.9 | 12.0 | 17.0 | 9.2 | 13.7 | 19.0 | 18.2 | 13.9 | 21.1 | 19.8 | 21.2 | 12.6 | 17.6 | 18.0 | ||
| 2011 | 26.0 | 21.6 | 20.9 | 26.9 | 18.8 | 15.5 | 20.1 | 16.4 | 33.1 | 32.3 | 16.4 | 26.5 | 25.3 | 23.7 | 17.5 | 27.8 | 23.5 | ||
| 2010 | 14.6 | 14.0 | 15.4 | 29.3 | 13.4 | 6.9 | 5.3 | 14.1 | 18.1 | 28.9 | 24.5 | 30.5 | 23.3 | 21.9 | 7.4 | 23.5 | 19.3 | ||
| 2009 | 26.6 | 24.0 | 26.7 | 32.4 | 18.3 | 12.7 | 19.3 | 23.3 | 29.8 | 29.1 | 13.0 | 11.7 | 18.8 | 27.9 | 17.6 | 25.8 | 23.9 | ||
| 2008 | 14.5 | 12.2 | 17.2 | 26.5 | 18.1 | 10.8 | 21.4 | 18.5 | 25.3 | 30.4 | 31.5 | 39.7 | 25.3 | 22.7 | 15.6 | 29.1 | 23.5 | ||
| 2007 | 20.9 | 17.6 | 33.2 | 35.5 | 17.6 | 20.8 | 10.6 | 19.1 | 28.1 | 25.2 | 30.9 | 13.0 | 15.4 | 31.6 | 16.6 | 27.5 | 23.7 | ||
| 2006 | 32.9 | 30.1 | 24.7 | 38.4 | 23.8 | 14.5 | 17.4 | 19.3 | 30.5 | 31.7 | 23.2 | 35.6 | 33.7 | 31.3 | 16.9 | 29.3 | 28.4 | ||
| 2005 | 25.7 | 16.8 | 24.2 | 9.9 | 17.9 | 16.7 | 16.3 | 22.8 | 22.1 | 38.3 | 29.9 | 37.0 | 29.7 | 18.3 | 17.8 | 29.4 | 23.9 | ||
| 2004 | 12.3 | 7.9 | 21.2 | 11.0 | 11.6 | 7.4 | 7.9 | 14.1 | 19.7 | 22.0 | 22.3 | 30.1 | 16.2 | 15.0 | 8.9 | 21.1 | 15.4 | ||
| 2003 | 27.4 | 33.1 | 26.3 | 18.1 | 18.8 | 12.3 | 13.3 | 21.4 | 19.3 | 25.8 | 18.6 | 11.2 | 23.0 | 21.3 | 15.6 | 21.6 | 20.3 | ||
| 2002 | 20.6 | 33.1 | 31.3 | 17.2 | 17.5 | 14.2 | 14.5 | 16.4 | 22.3 | 29.2 | 29.4 | 24.7 | 25.3 | 21.8 | 14.8 | 26.0 | 21.4 | ||
| 2001 | 28.9 | 23.5 | 30.9 | 22.7 | 19.9 | 15.2 | 10.0 | 11.9 | 20.5 | 22.4 | 31.8 | 30.5 | 27.9 | 25.7 | 12.7 | 23.8 | 22.5 | ||
| 2000 | 37.3 | 37.3 | 30.2 | 20.3 | 22.7 | 14.4 | 20.2 | 29.5 | 38.0 | 38.5 | 31.8 | 22.6 | 31.4 | 24.3 | 20.5 | 37.0 | 27.5 | ||
| 1999 | 17.6 | 12.4 | 26.4 | 15.1 | 13.0 | 8.1 | 11.7 | 20.7 | 13.0 | 29.4 | 43.8 | 44.9 | 33.0 | 18.5 | 13.3 | 28.5 | 23.0 | ||
| 1998 | 10.8 | 15.1 | 29.3 | 14.1 | 14.2 | 11.3 | 16.2 | 13.2 | 15.1 | 12.8 | 14.8 | 8.0 | 10.9 | 19.8 | 13.2 | 14.5 | 15.5 | ||
| 1997 | 5.7 | 10.3 | 12.7 | 9.2 | 7.7 | 5.8 | 7.8 | 7.0 | 20.0 | 13.8 | 17.8 | 23.6 | 12.9 | 9.9 | 6.6 | 16.0 | 11.1 | ||
| 1996 | 11.9 | 16.0 | 26.7 | 10.5 | 17.6 | 13.1 | 4.9 | 10.6 | 13.7 | 14.1 | 12.1 | 12.6 | 13.7 | 17.2 | 9.4 | 13.4 | 13.4 | ||
| 1995 | 6.5 | 10.1 | 5.8 | 7.9 | 10.0 | 6.9 | 3.5 | 7.9 | 10.2 | 10.5 | 13.0 | 13.8 | 10.1 | 8.0 | 5.7 | 11.0 | 8.8 | ||
| 1994 | 15.7 | 18.2 | 14.7 | 12.8 | 7.4 | 17.4 | 11.8 | 13.8 | 10.2 | 9.9 | 10.0 | 9.0 | 13.8 | 10.7 | 14.0 | 10.0 | 11.8 | ||
| 1993 | 14.3 | 23.1 | 11.3 | 16.0 | 16.7 | 21.7 | 10.2 | 9.4 | 29.6 | 30.0 | 19.5 | 17.4 | 18.9 | 14.8 | 14.2 | 26.1 | 19.1 | ||
| 1992 | 6.2 | 1.9 | 8.2 | 12.8 | 16.7 | 6.3 | 12.1 | 14.6 | 15.5 | 23.7 | 31.6 | 10.0 | 6.1 | 12.4 | 10.5 | 23.8 | 13.5 | ||
| 1991 | 15.7 | 11.7 | 10.5 | 10.7 | 12.4 | 8.1 | 7.1 | 12.0 | 15.9 | 25.4 | 3.3 | 14.0 | 14.0 | 11.2 | 8.9 | 14.8 | 12.3 | ||
| 1990 | 32.3 | 33.5 | 38.7 | 18.4 | 23.4 | 38.9 | 38.9 | 25.4 | 18.2 | 29.8 | 26.0 | 22.4 | 31.0 | 26.5 | 34.4 | 24.5 | 29.1 | ||
| 1989 | 37.2 | 43.5 | 57.6 | 53.8 | 41.4 | 48.3 | 38.8 | 36.1 | 40.0 | 46.2 | 42.8 | 32.7 | 38.4 | 51.5 | 41.5 | 43.1 | 43.9 | ||
| 1988 | 45.3 | 52.6 | 46.1 | 48.4 | 40.8 | 44.1 | 43.7 | 47.4 | 61.4 | 54.5 | 53.0 | 44.4 | 47.8 | 44.8 | 45.0 | 56.4 | 48.3 | ||
| 1987 | 27.3 | 33.3 | 40.9 | 30.9 | 43.3 | 34.1 | 31.3 | 23.8 | 36.4 | 44.9 | 45.0 | 44.6 | 43.0 | 38.8 | 29.4 | 42.3 | 37.7 | ||
| 1986 | 19.2 | 15.8 | 15.1 | 19.4 | 25.5 | 14.7 | 13.0 | 11.1 | 35.5 | 23.5 | 20.7 | 17.1 | 17.2 | 19.9 | 12.9 | 26.1 | 19.4 | ||
| 1985 | 6.7 | 6.7 | 9.6 | 3.5 | 8.8 | 8.3 | 12.5 | 5.9 | 36.4 | 10.5 | 30.0 | 17.9 | 10.2 | 6.7 | 8.2 | 22.5 | 9.3 | ||
| 1984 | 0.0 | 0.0 | 0.0 | 0.0 | 0.0 | 0.0 | 3.4 | 0.0 | 3.7 | 2.9 | 12.9 | 2.9 | 2.0 | 0.0 | 1.4 | 6.5 | 3.4 | ||
| 1983 | 0.0 | 0.0 | 0.0 | 7.7 | 22.2 | 0.0 | 0.0 | 9.1 | 0.0 | - | 0.0 | 0.0 | 0.0 | 11.1 | 3.3 | 0.0 | 4.0 | ||
| 1982 | - | 0.0 | - | 0.0 | 0.0 | 0.0 | - | 0.0 | - | 0.0 | - | 0.0 | 0.0 | 0.0 | 0.0 | 0.0 | 0.0 | ||
Breeding data
Breeding records by month
Number of breeding records by breeding code and month, 2017 and all years| Breeding code | Jul | Aug | Sep | Oct | Nov | Dec | Jan | Feb | Mar | Apr | May | Jun |
|---|---|---|---|---|---|---|---|---|---|---|---|---|
| 2017 | ||||||||||||
| Breeding (BLA code) | 0 | 1 | 0 | 0 | 0 | 0 | 0 | 0 | 0 | 0 | 0 | 0 |
| Carrying Food | 0 | 0 | 0 | 2 | 0 | 0 | 0 | 0 | 0 | 0 | 0 | 0 |
| Copulating | 0 | 0 | 0 | 0 | 0 | 0 | 0 | 0 | 0 | 0 | 0 | 0 |
| Display | 0 | 0 | 0 | 0 | 0 | 0 | 0 | 0 | 0 | 0 | 0 | 0 |
| Dependent young | 0 | 0 | 0 | 0 | 1 | 0 | 0 | 0 | 0 | 0 | 0 | 0 |
| Faecal sac | 0 | 0 | 0 | 0 | 0 | 0 | 0 | 0 | 0 | 0 | 0 | 0 |
| Inspecting hollow | 0 | 1 | 0 | 0 | 0 | 0 | 0 | 0 | 0 | 0 | 0 | 0 |
| Nest building | 0 | 0 | 2 | 0 | 0 | 0 | 0 | 0 | 0 | 0 | 0 | 0 |
| Nest with eggs | 0 | 0 | 0 | 0 | 0 | 0 | 0 | 0 | 0 | 0 | 0 | 0 |
| Nest with young | 0 | 0 | 0 | 0 | 0 | 0 | 0 | 0 | 0 | 0 | 0 | 0 |
| On/leaving nest | 0 | 1 | 0 | 2 | 0 | 0 | 0 | 0 | 0 | 0 | 0 | 0 |
| All years | ||||||||||||
| Breeding (BLA code) | 1 | 3 | 5 | 4 | 4 | 1 | 0 | 1 | 2 | 0 | 0 | 0 |
| Carrying Food | 0 | 0 | 0 | 4 | 2 | 3 | 1 | 0 | 0 | 0 | 0 | 0 |
| Copulating | 0 | 0 | 0 | 0 | 0 | 0 | 0 | 0 | 0 | 0 | 0 | 0 |
| Display | 0 | 0 | 1 | 2 | 1 | 0 | 0 | 0 | 0 | 0 | 0 | 0 |
| Dependent young | 0 | 0 | 0 | 5 | 6 | 5 | 8 | 4 | 1 | 0 | 0 | 0 |
| Faecal sac | 0 | 0 | 0 | 0 | 0 | 0 | 0 | 0 | 0 | 0 | 0 | 0 |
| Inspecting hollow | 0 | 2 | 2 | 12 | 1 | 2 | 1 | 0 | 1 | 0 | 0 | 1 |
| Nest building | 3 | 9 | 23 | 20 | 11 | 5 | 4 | 1 | 1 | 0 | 1 | 0 |
| Nest with eggs | 0 | 0 | 1 | 2 | 1 | 0 | 0 | 1 | 0 | 0 | 0 | 0 |
| Nest with young | 0 | 0 | 0 | 8 | 4 | 2 | 3 | 0 | 0 | 0 | 0 | 0 |
| On/leaving nest | 1 | 3 | 4 | 27 | 7 | 2 | 2 | 0 | 0 | 0 | 0 | 0 |
Breeding records by year
Average number of breeding records per period by breeding code| Period | Breeding (BLA code) | Carrying Food | Copulating | Display | Dependent young | Faecal sac | Inspecting hollow | Nest building | Nest with eggs | Nest with young | On/leaving nest |
|---|---|---|---|---|---|---|---|---|---|---|---|
| All years | |||||||||||
| All | 0.6 | 0.3 | 0.0 | 0.1 | 0.8 | 0.0 | 0.6 | 2.2 | 0.1 | 0.5 | 1.3 |
| Previous years | |||||||||||
| All previous years | 0.6 | 0.2 | 0.0 | 0.1 | 0.8 | 0.0 | 0.6 | 2.2 | 0.1 | 0.5 | 1.2 |
| Previous 30 years | 0.7 | 0.3 | 0.0 | 0.1 | 0.9 | 0.0 | 0.7 | 2.5 | 0.2 | 0.6 | 1.4 |
| Previous 20 years | 1.0 | 0.3 | 0.0 | 0.1 | 0.7 | 0.0 | 0.9 | 1.9 | 0.0 | 0.4 | 2.1 |
| 10 year groups | |||||||||||
| [2007,2017) | 0.7 | 0.5 | 0.0 | 0.1 | 1.1 | 0.0 | 1.4 | 2.3 | 0.1 | 0.8 | 3.3 |
| [1997,2007) | 1.3 | 0.1 | 0.0 | 0.2 | 0.3 | 0.0 | 0.5 | 1.5 | 0.0 | 0.0 | 1.0 |
| [1987,1997) | 0.0 | 0.2 | 0.0 | 0.1 | 1.4 | 0.0 | 0.2 | 3.8 | 0.4 | 0.9 | 0.0 |
| 5 year groups | |||||||||||
| [2012,2017) | 0.8 | 0.4 | 0.0 | 0.0 | 1.6 | 0.0 | 1.2 | 2.6 | 0.0 | 1.4 | 2.8 |
| [2007,2012) | 0.6 | 0.6 | 0.0 | 0.2 | 0.6 | 0.0 | 1.6 | 2.0 | 0.2 | 0.2 | 3.8 |
| [2002,2007) | 1.0 | 0.2 | 0.0 | 0.2 | 0.4 | 0.0 | 0.4 | 1.6 | 0.0 | 0.0 | 1.6 |
| [1997,2002) | 1.6 | 0.0 | 0.0 | 0.2 | 0.2 | 0.0 | 0.6 | 1.4 | 0.0 | 0.0 | 0.4 |
| [1992,1997) | 0.0 | 0.0 | 0.0 | 0.2 | 0.0 | 0.0 | 0.4 | 1.0 | 0.0 | 0.0 | 0.0 |
| [1987,1992) | 0.0 | 0.4 | 0.0 | 0.0 | 2.8 | 0.0 | 0.0 | 6.6 | 0.8 | 1.8 | 0.0 |
| Year | |||||||||||
| 2017 | 1.0 | 2.0 | 0.0 | 0.0 | 1.0 | 0.0 | 1.0 | 2.0 | 0.0 | 0.0 | 3.0 |
| 2016 | 1.0 | 0.0 | 0.0 | 0.0 | 2.0 | 0.0 | 1.0 | 1.0 | 0.0 | 2.0 | 6.0 |
| 2015 | 1.0 | 0.0 | 0.0 | 0.0 | 3.0 | 0.0 | 2.0 | 7.0 | 0.0 | 1.0 | 1.0 |
| 2014 | 0.0 | 0.0 | 0.0 | 0.0 | 2.0 | 0.0 | 0.0 | 2.0 | 0.0 | 3.0 | 1.0 |
| 2013 | 1.0 | 1.0 | 0.0 | 0.0 | 1.0 | 0.0 | 3.0 | 1.0 | 0.0 | 1.0 | 0.0 |
| 2012 | 1.0 | 1.0 | 0.0 | 0.0 | 0.0 | 0.0 | 0.0 | 2.0 | 0.0 | 0.0 | 6.0 |
| 2011 | 0.0 | 1.0 | 0.0 | 0.0 | 1.0 | 0.0 | 1.0 | 2.0 | 0.0 | 0.0 | 6.0 |
| 2010 | 1.0 | 1.0 | 0.0 | 0.0 | 0.0 | 0.0 | 3.0 | 0.0 | 0.0 | 0.0 | 3.0 |
| 2009 | 1.0 | 1.0 | 0.0 | 0.0 | 0.0 | 0.0 | 1.0 | 3.0 | 0.0 | 0.0 | 5.0 |
| 2008 | 0.0 | 0.0 | 0.0 | 1.0 | 2.0 | 0.0 | 3.0 | 1.0 | 0.0 | 1.0 | 2.0 |
| 2007 | 1.0 | 0.0 | 0.0 | 0.0 | 0.0 | 0.0 | 0.0 | 4.0 | 1.0 | 0.0 | 3.0 |
| 2006 | 3.0 | 1.0 | 0.0 | 1.0 | 0.0 | 0.0 | 1.0 | 3.0 | 0.0 | 0.0 | 5.0 |
| 2005 | 0.0 | 0.0 | 0.0 | 0.0 | 1.0 | 0.0 | 0.0 | 3.0 | 0.0 | 0.0 | 1.0 |
| 2004 | 0.0 | 0.0 | 0.0 | 0.0 | 0.0 | 0.0 | 1.0 | 1.0 | 0.0 | 0.0 | 0.0 |
| 2003 | 0.0 | 0.0 | 0.0 | 0.0 | 1.0 | 0.0 | 0.0 | 1.0 | 0.0 | 0.0 | 1.0 |
| 2002 | 2.0 | 0.0 | 0.0 | 0.0 | 0.0 | 0.0 | 0.0 | 0.0 | 0.0 | 0.0 | 1.0 |
| 2001 | 0.0 | 0.0 | 0.0 | 1.0 | 0.0 | 0.0 | 0.0 | 1.0 | 0.0 | 0.0 | 0.0 |
| 2000 | 8.0 | 0.0 | 0.0 | 0.0 | 0.0 | 0.0 | 3.0 | 5.0 | 0.0 | 0.0 | 0.0 |
| 1999 | 0.0 | 0.0 | 0.0 | 0.0 | 0.0 | 0.0 | 0.0 | 1.0 | 0.0 | 0.0 | 2.0 |
| 1998 | 0.0 | 0.0 | 0.0 | 0.0 | 1.0 | 0.0 | 0.0 | 0.0 | 0.0 | 0.0 | 0.0 |
| 1997 | 0.0 | 0.0 | 0.0 | 0.0 | 0.0 | 0.0 | 0.0 | 0.0 | 0.0 | 0.0 | 0.0 |
| 1996 | 0.0 | 0.0 | 0.0 | 1.0 | 0.0 | 0.0 | 0.0 | 1.0 | 0.0 | 0.0 | 0.0 |
| 1995 | 0.0 | 0.0 | 0.0 | 0.0 | 0.0 | 0.0 | 1.0 | 0.0 | 0.0 | 0.0 | 0.0 |
| 1994 | 0.0 | 0.0 | 0.0 | 0.0 | 0.0 | 0.0 | 1.0 | 2.0 | 0.0 | 0.0 | 0.0 |
| 1993 | 0.0 | 0.0 | 0.0 | 0.0 | 0.0 | 0.0 | 0.0 | 2.0 | 0.0 | 0.0 | 0.0 |
| 1992 | 0.0 | 0.0 | 0.0 | 0.0 | 0.0 | 0.0 | 0.0 | 0.0 | 0.0 | 0.0 | 0.0 |
| 1991 | 0.0 | 0.0 | 0.0 | 0.0 | 1.0 | 0.0 | 0.0 | 0.0 | 0.0 | 0.0 | 0.0 |
| 1990 | 0.0 | 0.0 | 0.0 | 0.0 | 1.0 | 0.0 | 0.0 | 0.0 | 0.0 | 0.0 | 0.0 |
| 1989 | 0.0 | 2.0 | 0.0 | 0.0 | 1.0 | 0.0 | 0.0 | 12.0 | 1.0 | 2.0 | 0.0 |
| 1988 | 0.0 | 0.0 | 0.0 | 0.0 | 8.0 | 0.0 | 0.0 | 15.0 | 1.0 | 1.0 | 0.0 |
| 1987 | 0.0 | 0.0 | 0.0 | 0.0 | 3.0 | 0.0 | 0.0 | 6.0 | 2.0 | 6.0 | 0.0 |
| 1986 | 0.0 | 0.0 | 0.0 | 0.0 | 0.0 | 0.0 | 0.0 | 0.0 | 0.0 | 0.0 | 0.0 |
| 1985 | 0.0 | 0.0 | 0.0 | 0.0 | 0.0 | 0.0 | 0.0 | 0.0 | 0.0 | 0.0 | 0.0 |
| 1984 | 0.0 | 0.0 | 0.0 | 0.0 | 0.0 | 0.0 | 0.0 | 0.0 | 0.0 | 0.0 | 0.0 |
| 1983 | 0.0 | 0.0 | 0.0 | 0.0 | 0.0 | 0.0 | 0.0 | 0.0 | 0.0 | 0.0 | 0.0 |
| 1982 | 0.0 | 0.0 | 0.0 | 0.0 | 0.0 | 0.0 | 0.0 | 0.0 | 0.0 | 0.0 | 0.0 |
Distribution map
Distribution - 2017
This map shows the observed distribution of the Spotted Pardalote for 2017.
The red circles are the grid cells where Spotted Pardalote have been reported.
The transparency of the red circles indicate how many surveys sheets were submitted for that grid cell; the darker the red the more reliable the data. Of the 315 grid cells with reports, 83 had only one sheet; an example is grid number A9.
The size of the circle represents the reporting rate. The maximum reporting rate for Spotted Pardalote was 100.0% (eg grid number A9) and the minimum was 1.3% (eg grid number K10). 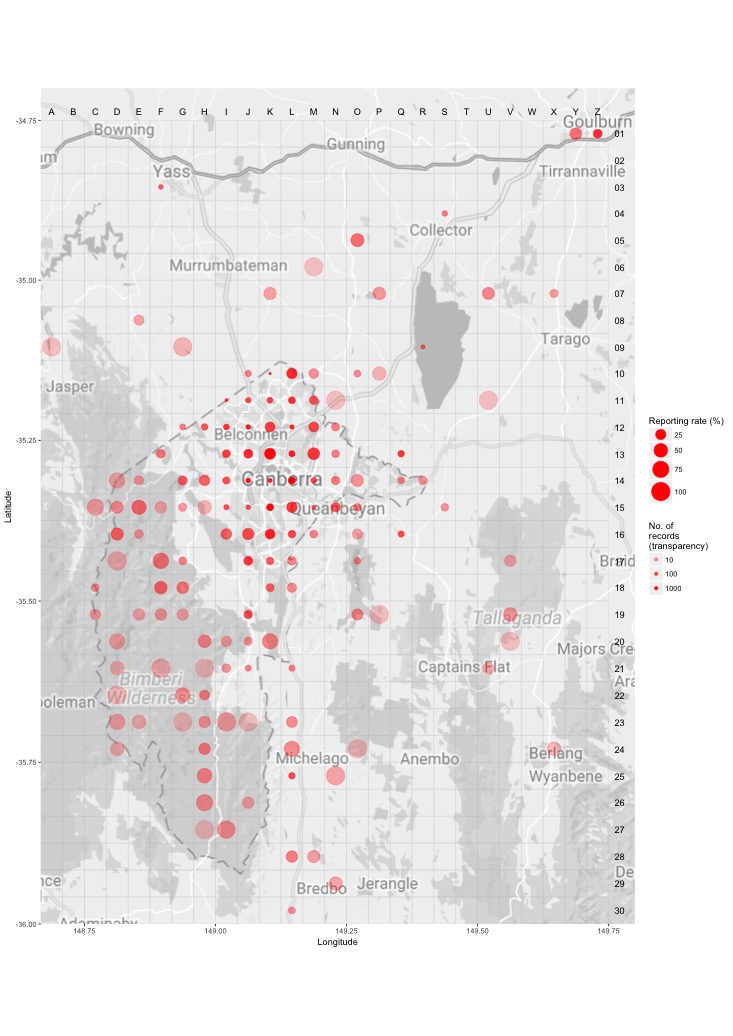
Distribution - all years
This map shows the observed distribution of the Spotted Pardalote for all years.
The red circles are the grid cells where Spotted Pardalote have been reported.
The transparency of the red circles indicate how many surveys sheets were submitted for that grid cell; the darker the red the more reliable the data. Of the 703 grid cells with reports, 55 had only one sheet; an example is grid number C10.
The size of the circle represents the reporting rate. The maximum reporting rate for Spotted Pardalote was 100.0% (eg grid number A15) and the minimum was 0.3% (eg grid number Z8). 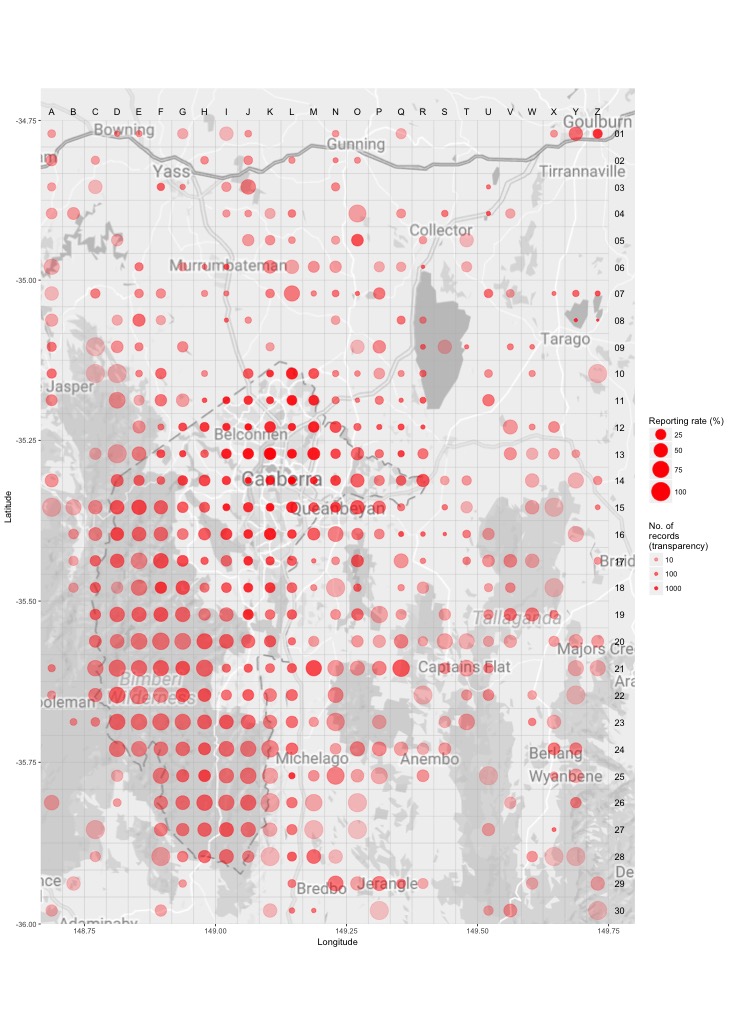
Breeding map
Breeding - 2017
This map shows the breeding distribution of the Spotted Pardalote for 2017.
The red circles are the grid cells where breeding activity for Spotted Pardalote have been reported.
The size of the circle represents the number of reports. 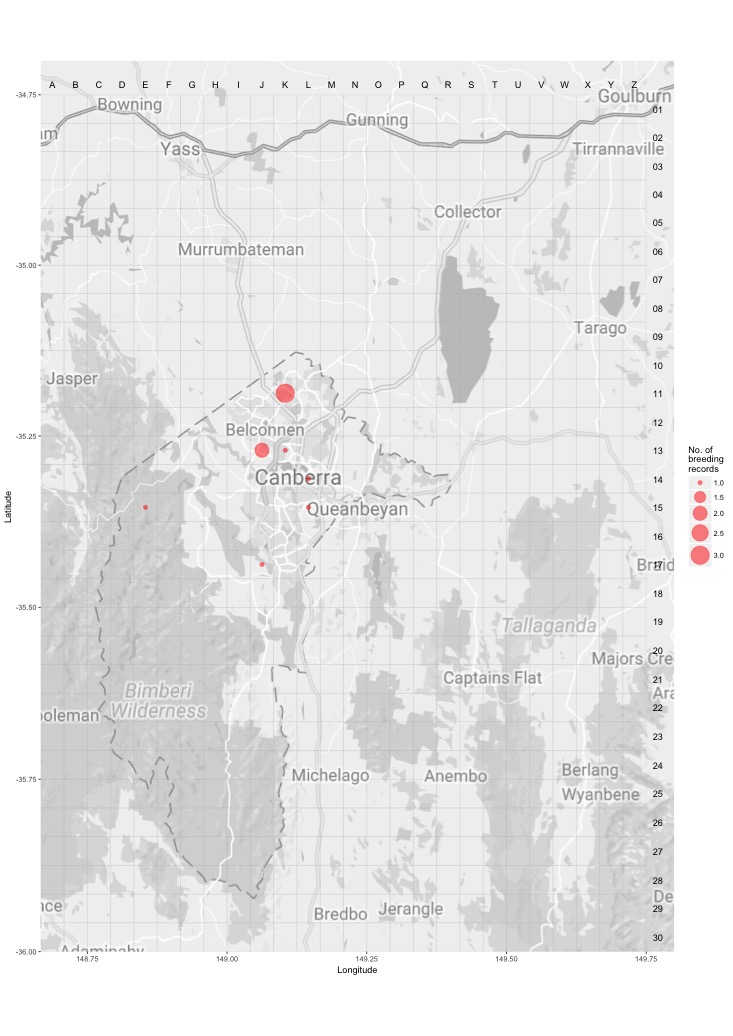
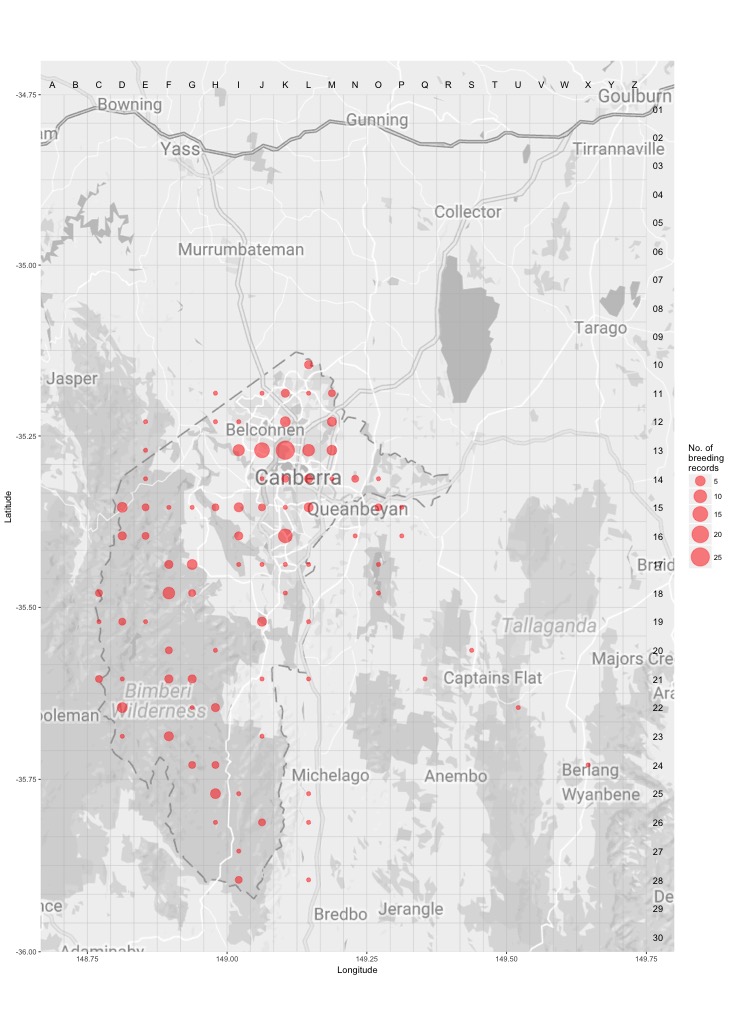
Breeding - all years
This map shows the breeding distribution of the Spotted Pardalote for all years.
The red circles are the grid cells where breeding activity for Spotted Pardalote have been reported.
The size of the circle represents the number of reports.